XSLT Debugging
This article will outline how to debug your XSLT mapping files in Visual Studio whilst running Zynk.
1. Disable Just My Code
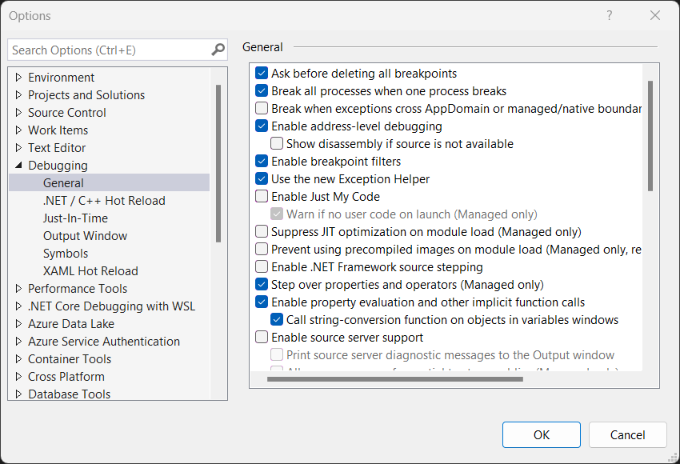
Firstly, you need to make sure that 'Just My Code' is disabled in Visual Studio. This setting is located in Tools -> Options -> Debugging -> Enable Just My Code (shown below).

2. Attach to Process
Secondly, attach the Zynk process to Visual Studio. You can do this in Visual Studio by navigating to Debug -> Attach to Process and selecting 'Zynk.exe'.

3. Open XSLT in Visual Studio
Before debugging the XSLT, you will need to open the file in Visual Studio. You can drag and drop the file from explorer into Visual Studio or navigate to File -> Open and select the file.
You can set breakpoints in Visual Studio by clicking the farmost panel on the left, corresponding with the line number you'd like to step into.
4. Run Zynk
Finally, run the XSLT Transform task from your Zynk workflow to start debugging your XSLT in Visual Studio!